Introduction to Cohort Analysis

As product managers, it’s critical for us to understand the lasting impact that we have on our users – and one of the easiest ways to do so is through cohort analysis.
What’s a cohort analysis? Let’s break down each term.
A cohort simply means a group of people.
As an example, let’s look at graduation year. For your school, the class of 2010 is one cohort, and the class of 2011 is a different cohort.
You can create any cohort that you’d like. For example, you can cohort by median household income. You can cohort by a marketing campaign. You can cohort by age.
A cohort analysis, then, is a data visualization of behavior over time, split up by cohorts.
In other words, you want to look for how behavior changes over time, and how that differs from cohort to cohort.
It’s easiest to do cohort analyses for consumer products, so we’ll begin our introduction here. Then, in our next article, I’ll talk through why B2B cohort analytics are uniquely different.
So, let’s talk B2C cohort analyses!
Example of a B2C Cohort Analysis
Here’s a fictional example of a B2C cohort analysis on retention:
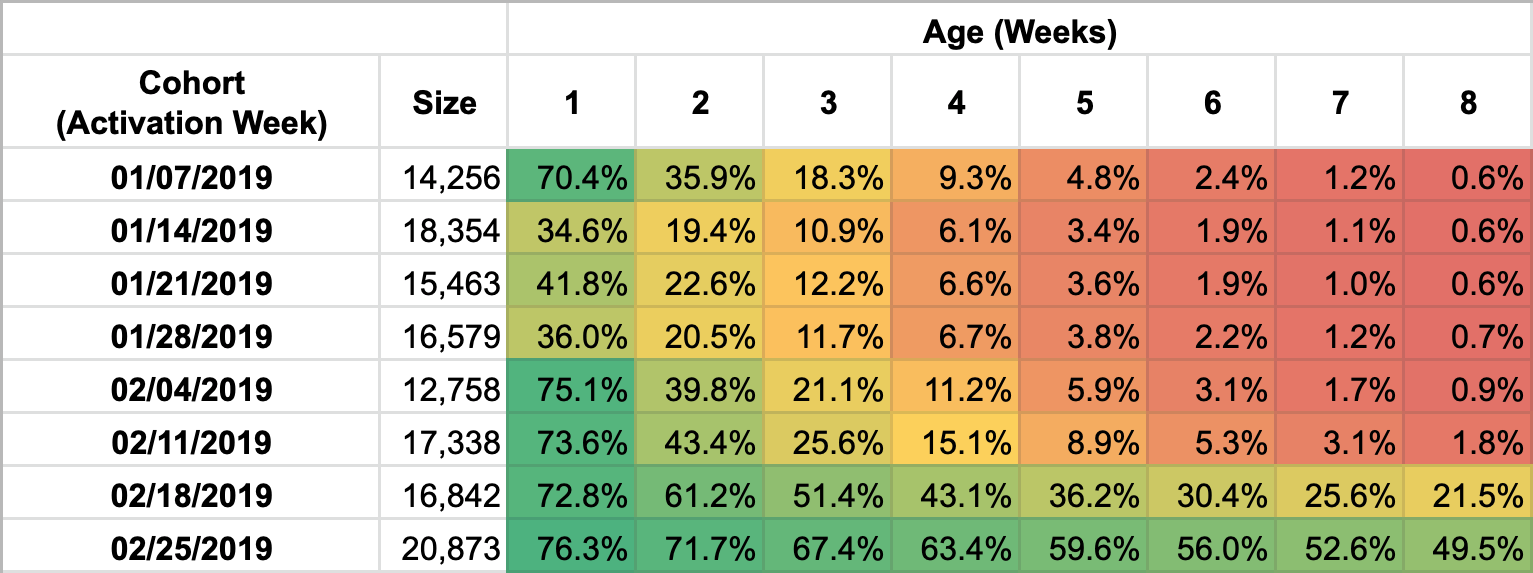
The diagram is two-dimensional, so you have to learn how to read both axes. First, let’s start by reading from left-to-right, starting on the first row of the analysis.
We have a group of users who all activated their new accounts on the week of Jan 7, 2019. This group of users had 14,256 users within it.
After the first week, only 70.4% of users were still active in our fictional product – in other words, 14,256 * 70.4% = 10,036 users continued to be active.
After two weeks, only 35.9% of users were still active in our fictional product – in other words, 14,256 * 35.9% = 5,118 users continued to be active.
As you read from left to right, you can watch this cohort of users over time. Generally speaking, cohorts generally get smaller over time, because fewer and fewer users are still interested in the product.
After 8 weeks, this entire cohort is nearly gone – only 85 users (0.6%) remain from the initial cohort.
Now, let’s try reading from top to bottom.
Our second set of users activated in the week of Jan 14, 2019. This particular week, we had 18,354 new users activate their accounts in our fictional B2C product, which is 29% larger.
While we might have claimed victory for having more users in this cohort, we can immediately see that this new cohort performs much worse in retention.
In their very first week, we have only 34.6% retention versus the 70.4% retention of the first cohort.
That’s a relative difference of 51%, which definitely doesn’t make up for the slightly larger size of our second cohort.
If we keep reading down the column of week 1, we can see that cohorts 2-4 all performed poorly, whereas cohorts 1, 5, 6, 7, and 8 all performed similarly.
But, if we read down the column of week 8, it’s clear that cohorts 7 and 8 have much stronger retention versus the other cohorts!
If you go through the PMHQ community, you’ll find that a lot of product experts rely on cohort analyses.

Insights to Draw from B2C Cohort Analyses
What sort of things can you learn from B2C cohort analyses?
First, cohort analysis enables you to break out by various groups, rather than by looking at a total metric.
For example, here’s what a graph of active user count would look like if we didn’t split out by cohort:
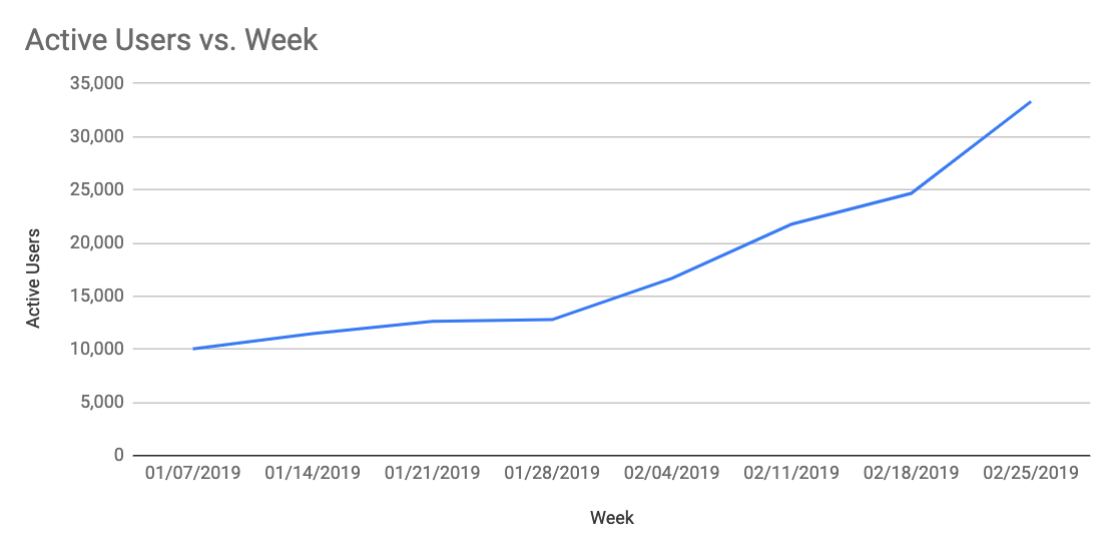
It looks like our active users are growing rapidly!
However, from this graph, we can’t tell that our first few cohorts had really bad retention rates.
In fact, this graph doesn’t tell us that our initial cohort nearly all dropped out of our product!
Second, cohort analyses enable you to establish a baseline against which to conduct rapid experimentation. Here’s the cohort analysis again:

Let’s say that on the week of Jan 7, we didn’t perform any experiments and that this was our baseline.
In our very next cohort, let’s say that we implemented a new landing page. That new landing page clearly gave us many more user activations (+29%), but these users are less loyal to the product (-51% retention in week 1).
As we continue to iterate on the landing page for the next 2 weeks, we found that we weren’t able to bring in users who would be more likely to stick.
For our 4th cohort, let’s say that we reverted to our original landing page in cohort 1. We see that user behavior is pretty similar in cohort 1 and cohort 4.
From here, someone in our customer support department suggests providing a live chat tool within the product itself. In cohort 5, while we have way fewer users in the cohort, we notice that retention is doing better!
For cohort 6, we tweak the chat tool a bit but we don’t see much improvement. During week 6, someone in our finance department proposes letting users pay at the end of the month, rather than having them pay upfront.
For cohort 7, once we’ve implemented the new payment method as an experiment, suddenly we see retention skyrocket throughout the life of the cohort.
Now, someone in our growth department suggests adding in user forums as well, which we implement just in time for cohort 8.
For cohort 8, the user forums are a big hit – users stay active for even longer.
By using cohort analyses, we can run tests frequently and see how the test impacts the entire group of users through their entire lifecycle with our product.
Finally, cohort analyses are fantastic for identifying whether you have a retention problem or a user acquisition problem.
Many times, when B2C companies stall out in their growth, they’ll try to add fuel to the fire by doing more sales and marketing. Yet, their growth continues to stay stuck. That’s because they may not be checking for the retention of their previous cohorts.
A B2C product that is too focused on adding new users without keeping their existing ones will wind up losing their user base very quickly.
On the other hand, if you retain older cohorts, then you prevent having a leaky bucket. That way, you add more users than you lose each week, which means that your user base will grow!
Summary
Cohort analyses are a powerful way to supercharge your analytics. Instead of measuring a top-level metric, you can now see behavior cut across multiple dimensions.
Most B2C cohort analyses will cohort by time because it’s critical to identify the retention patterns for older cohorts while bringing in new cohorts to the product.
In our next article, we’ll cover how to conduct cohort analyses for B2B products – these are far trickier, but are well worth the additional investment!
For now, you can check out our Product Manager certification courses tailored for your product management needs.
Have thoughts that you’d like to contribute around cohort analyses? Chat with other product managers around the world in our PMHQ Community!


